Workforce allows users to generate a wide variety of customized payroll incidences reports, making it easy to modify fields on these reports to tailor data to specific needs and metrics.
Start from: The Workforce module.
-
Select Scheduling > Weekly ROTAs from the main menu.
-
Select the Work Center where the shift you wish to analyze is located.
-
Select the Arrow icon in the field of the shift you wish to analyze.
-
On the Projected Shift screen, select the Analysis button.
Productivity by total demand
Once the Analysis button is selected, the following screen will be displayed:
-
Direct Work Default.
-
Indirect Work Default.
-
Surplus of Projected Hours over Ideal Hours.
-
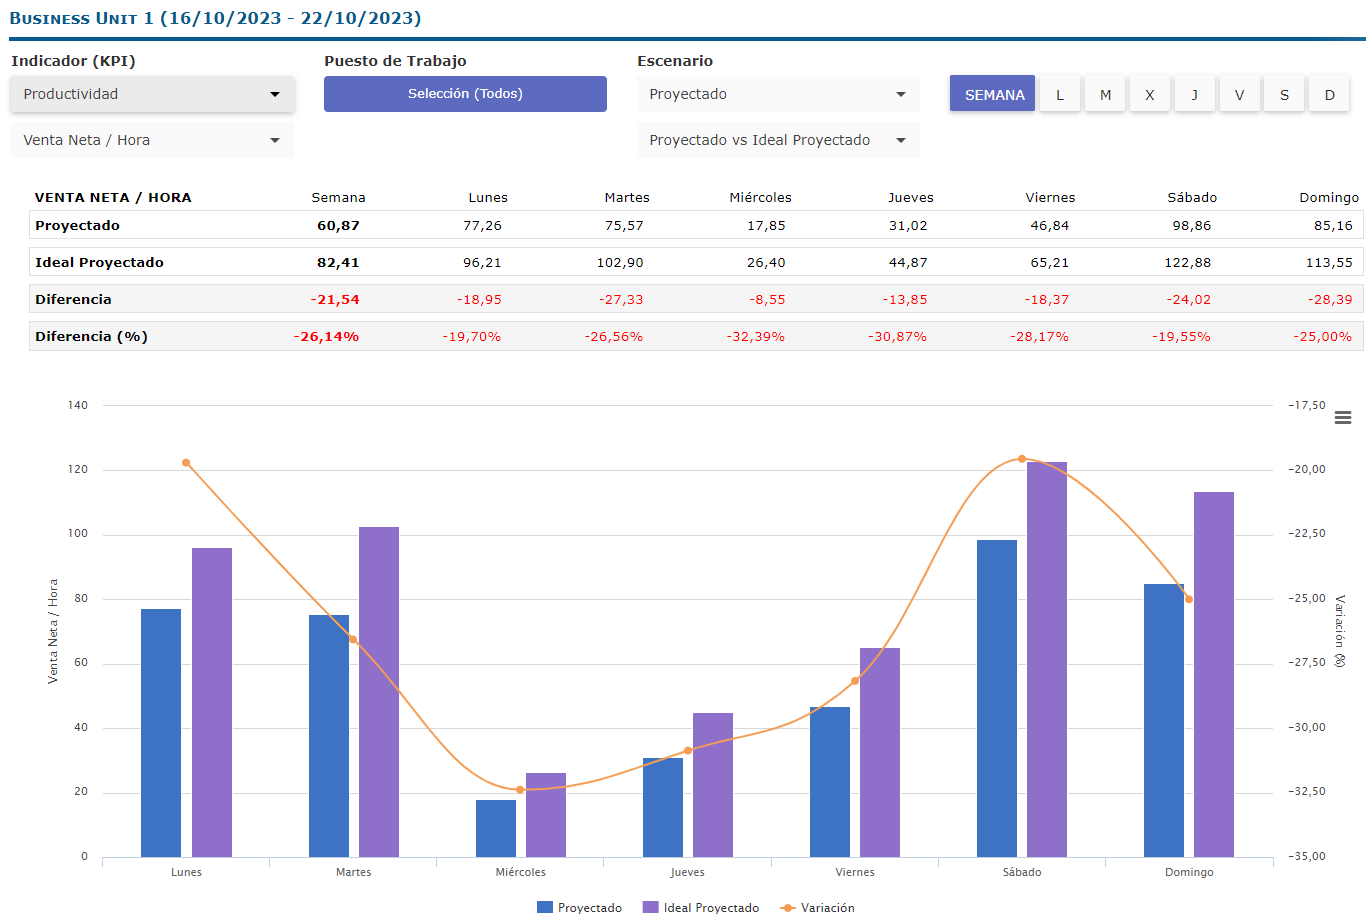
Indicator (KPI): this is the indicator that will be seen and studied in the report. Scroll down the list and select Productivity. Productivity can be measured using five possible ratios:
-
Net Hourly Sales
-
Hourly Tickets
-
Hourly Customers
-
Minutes per Ticket
-
Minutes per Customer
-
-
Workstation: productivity measurement can be done by total demand (the entire center) or by workstation. However, in order to be able to display it by workstations, there must be a previous configuration of direct work and indirect work (table by workstations) in the shift; otherwise, the option will be blocked.
-
Scenario: will be the context in which the selected KPI is integrated. It will be possible to choose between the Projected and, once the turn is over, also the Actual. In the case of productivity measurement, an additional drop-down appears to show the comparison options according to your selection:
-
If the scenario is Projected, the options will be: Projected vs Projected Ideal, and Projected vs Budget.
-
If the scenario is Actual, the options will be: Actual vs Projected, Actual vs Actual Ideal, Actual vs Budget.
-
Notes: The term Ideal refers to the number of employees or hours that best fit the shifts based on budget and direct work configuration. Although the Ideal cannot always be reached due to legal regulations or personnel limitations, it is considered that the closer to the ideal, the better.
-
Time Period: can be weekly or daily.
Metrics visualization
After selecting the parameters, in any of the cases, a table will be displayed with the productivity indicators for the selected days, as well as the comparisons that have been established in the Scenario.
The graphs to be shown are curves indicating productivity growth or decline over the selected period, as well as bars indicating day-to-day differences.
Graphics can be downloaded in image (.JPG, .PNG), document (.PDF), and vector (.SVG) formats.
Originally published at https://help.mapal-os.com/workforce/scheduling/weekly-rotas/view-productivity/
Was this article helpful?
Articles in this section
- Manage workstations for all employees in a ROTA
- Change the order of employees in a shift
- Configure favorite shifts
- Mark shift as completed
- Copy shifts
- Delete and restart weekly shifts (ROTAs)
- View shift graphs and analytics
- View absenteeism incident from a shift
- Print, assign, and swap shifts
- View personnel costs
Add comment
Please sign in to leave a comment.