the Engagement tool enables you to communicate with your employees and measure their engagement with your company. As a manager, you can get a quick overview of how your team is doing by viewing your activity on the Engagement dashboard.
Start from: The Engagement dashboard.
When accessing the Engagement tool, the first page you see is the Dashboard. This page shows you a summary of your data for the last month (30 days) and for the whole company, by default.
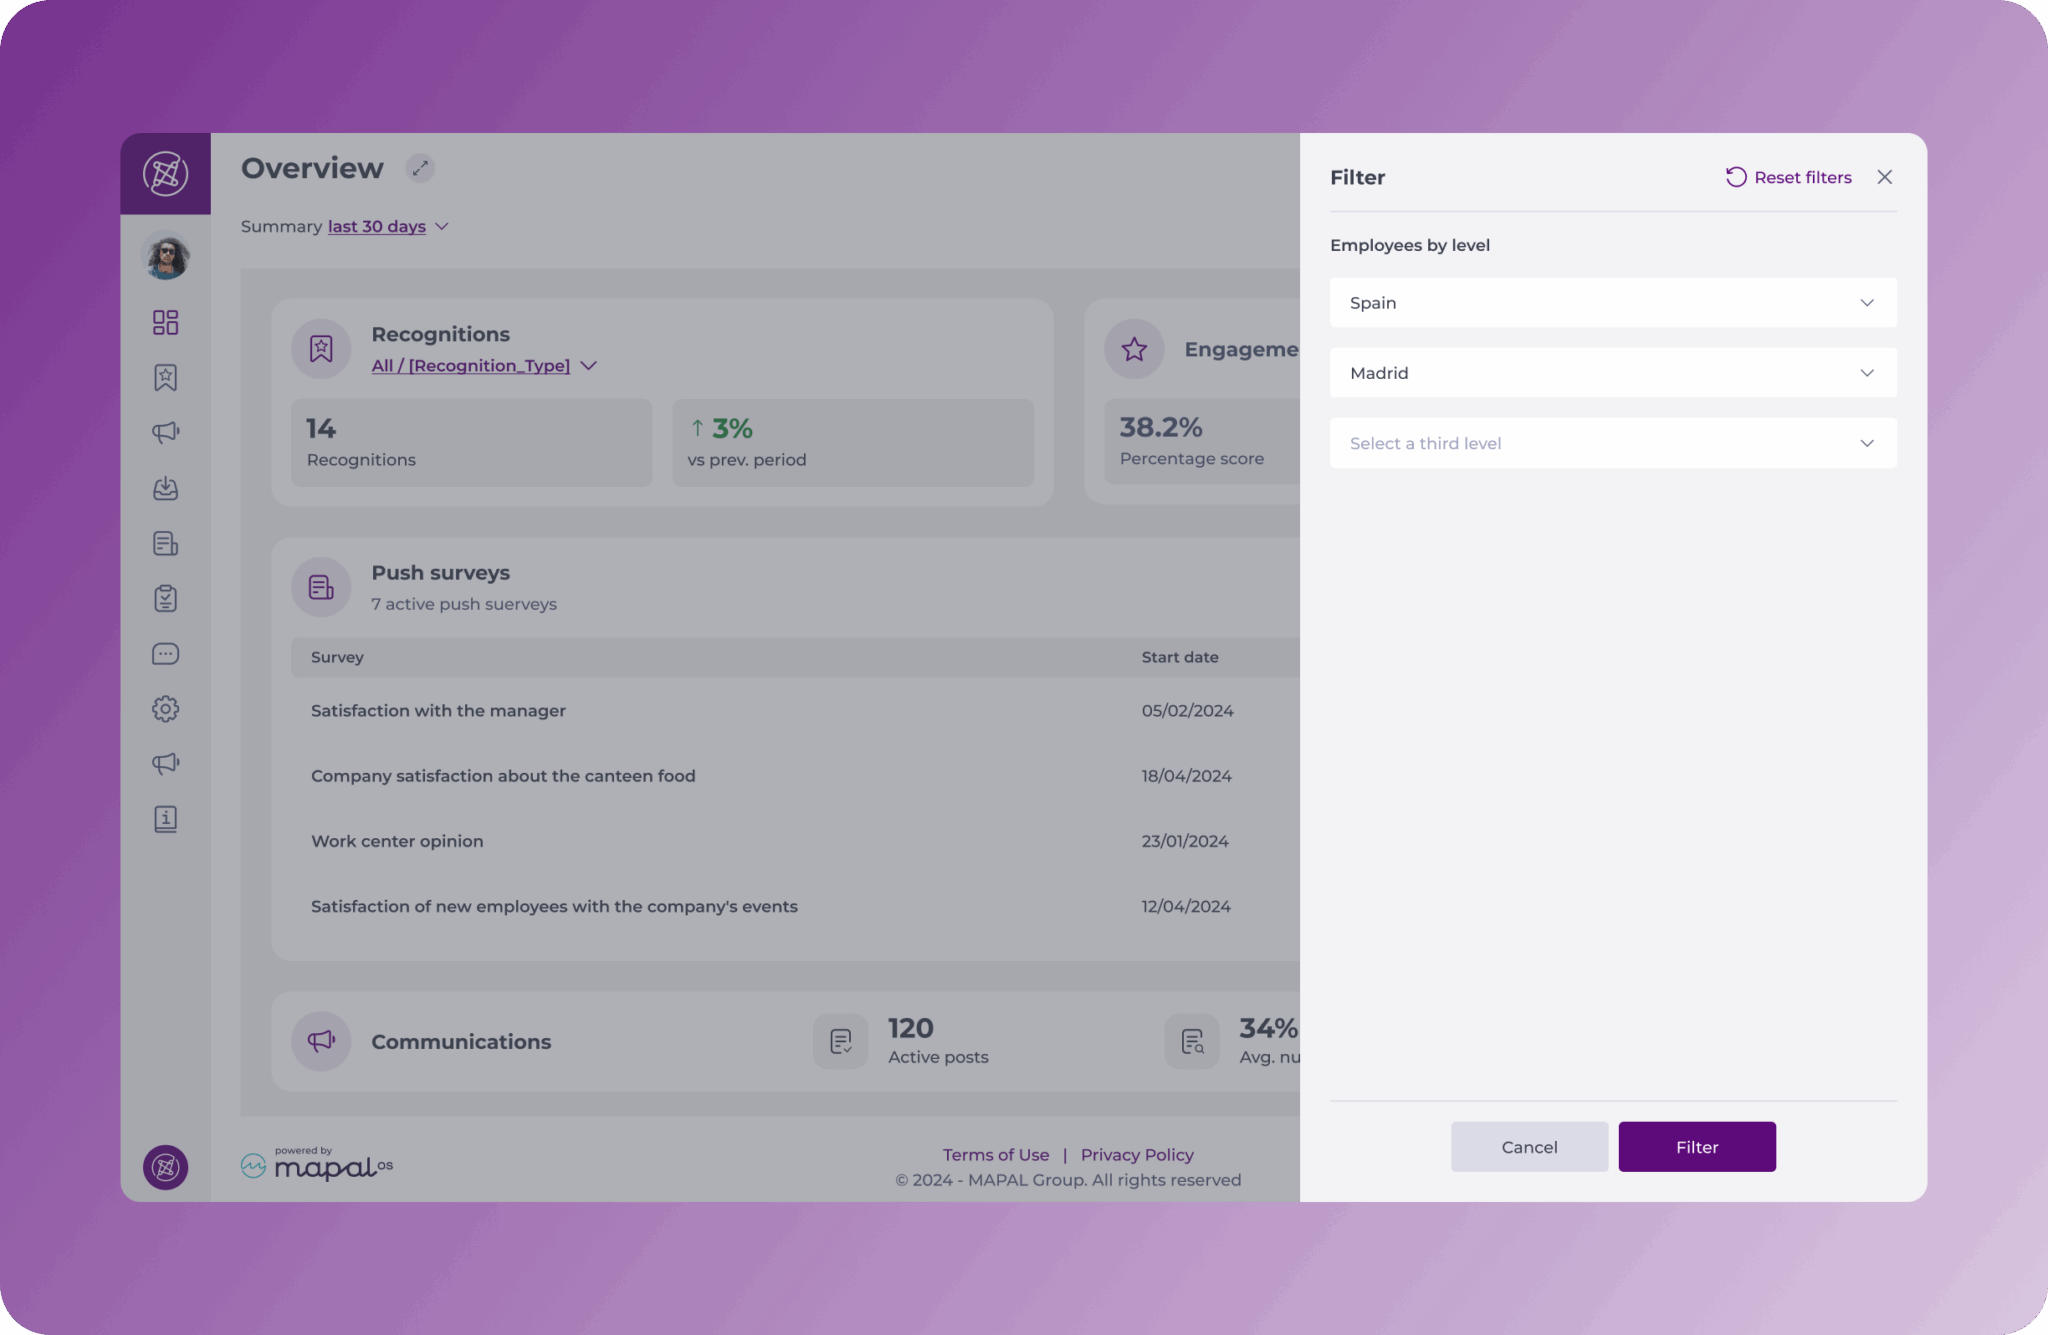
- Use the Filter button to view your data for different time periods and for specific levels or departments of the company.

Using level filters
There are three dropdown options: Level 1, 2 and 3.
- If you don’t select anything for these, you’ll see data for the whole company.
- If you’d like to filter the data to a level 1 only (for example, establishments in Spain), search for it in the corresponding dropdown list and select it.
- If you’d like to view data for a specific level 2 (a sub-level within your level 1 of the company; for example, establishments in ‘Madrid’, within the ‘Spain’ group of establishments in your company), you must first select the level 1 to which it belongs to (Spain), and then select the level 2 for which you want to see information (Madrid).
- The same goes for level 3 establishments.
You can set up and manage your different levels in the Configuration app within Mapal OS (Mapal OS main dashboard > Configuration > Settings > Org chart).
Originally published at https://help.mapal-os.com/engagement/dashboard-engagement/view-your-activity-using-the-dashboard/
Add comment
Please sign in to leave a comment.